When we launched our report, The Secret Shame: How America’s Most Progressive Cities Betray Their Commitment to Educational Opportunity for All, we included a good-faith effort to identify the variables most likely to explain away the stark difference between the country’s progressive and conservative cities and made it clear that the data was inconclusive as to why the differences exists.
After publishing, critics suggested we explore income inequality data further to see if it could, in fact, explain the larger gaps in progressive cities. Always open to new learning, we took their advice and sliced the data in even more ways to see if it changed our findings. In almost every reasonable way we could crunch the data, math and reading achievement gaps and graduation rates in progressive cities were larger when compared to conservative cities. But there was one exception: One of the regression methods — the 2016 Brookings Institution approach — erased the significance of our findings between progressive and conservative cities. Given the evidence we present below, however, we have good reason to be skeptical of the validity of that approach.
Before we get into the details, you should know: The bottom line is that, for whatever reason, progressive cities have alarmingly large racial achievement gaps in math, reading and graduation rates. Regardless of the political comparison, when you compare the realities in our most progressive cities to the values progressives prioritize, the evidence betrays those values. And that’s a shame — an unfortunate truth that’s been pushed far from the spotlight and hidden in the shadows. It’s time to shine a bright light on this issue and call leaders and communities together to address it.
Our Deeper Analysis
In our initial report we looked at several possible factors that might explain why progressive cities have such significantly larger achievement gaps than conservative cities including population size, percentage of white students, per-pupil spending, percent of students attending private schools, income inequality and poverty rates (see pages 12-14 of The Secret Shame). For population size and percent of white students we ran complete regression analyses. For the other factors, we made logical conclusions from a cursory review of the data.
For our deeper analysis, we completed a regression analysis for the Gini Index, and did quartile comparisons using data from the Bureau of Labor Statistics (BLS), Brookings Institution, and the U.S. Census (American Community Survey IPUMS data).
Gini Index Regression
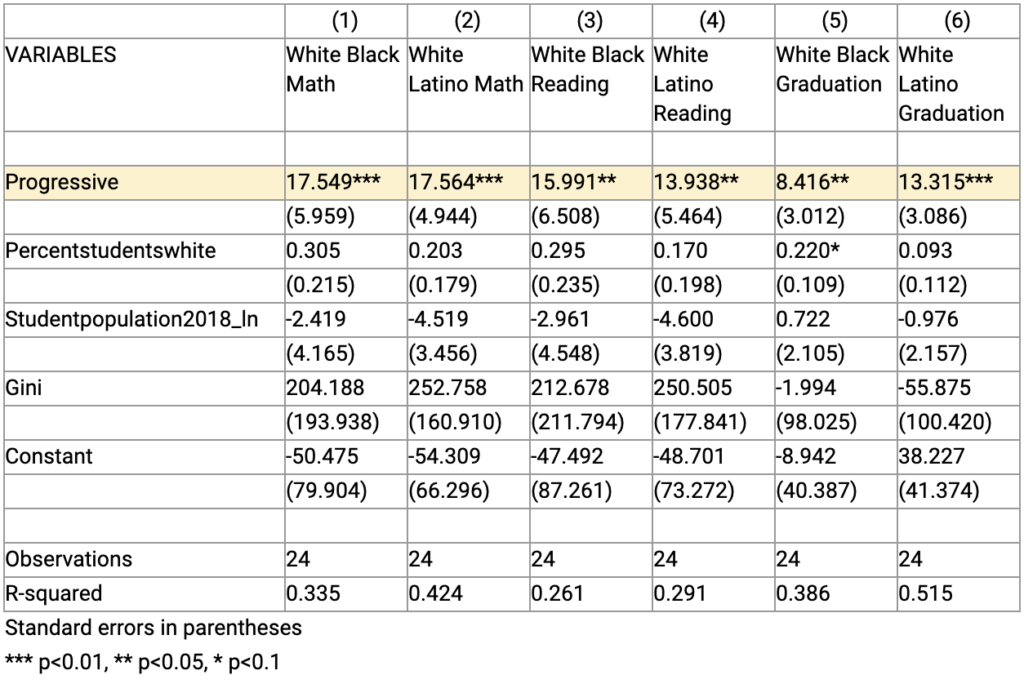
Adding the Gini variable to the regression did not change the practical significance of the gaps between progressive and conservative cities. The black-white and Latino-white achievement gaps in math and reading are actually slightly larger (by roughly one percentage point) in these new regressions, while the two high school graduation gaps are slightly reduced (by roughly one-tenth of a percentage point). These results are what we should expect given that the average Gini coefficients are nearly identical in the progressive and conservative city groups.
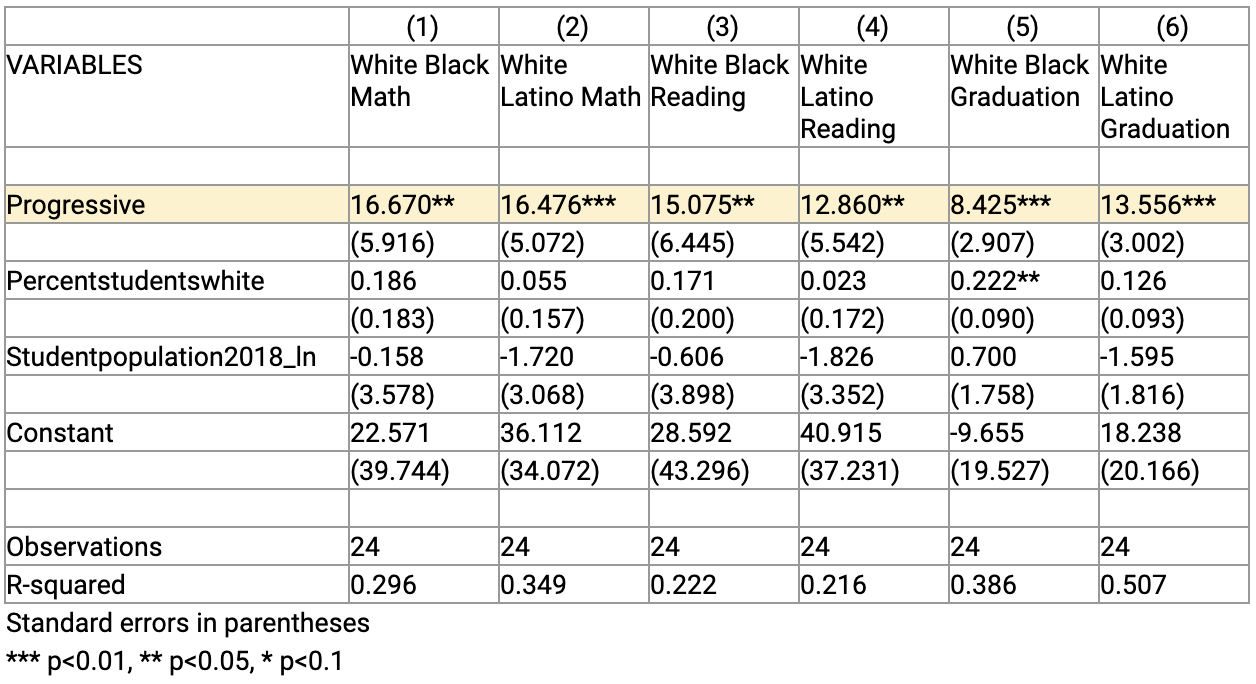
Compare Table 3 from the original report to Table 1S (for “Supplemental”), which is revised to include the Gini Index regression results. The “Progressive” row is the key row in each of the tables below, representing the average gap in math and reading scores and high school graduation rates in our progressive cities compared to our conservative cities.
Table 3. Effect of Being a Progressive City on Racial Education Gaps Controlling for District Percentage of White Students and District Size (from page 27 of The Secret Shame)
Table 1S. Regression Test with Gini Index
Adding the Gini Index as a new variable changes the statistical significance of two of the six regressions. The black-white math gap becomes statistically significant at the 99 percent confidence level (previously the 95 percent level) and the black-white graduation gap becomes statistically significant at the 95 percent confidence level (previously the 99 percent level). Most importantly, all six coefficients on the progressive variable remain statistically significant at the 95 percent (or higher) confidence level.
Specifically, the gap differences barely changed at all in size, accounting for the level of income inequality. Although some of the gap differences changed categories (i.e. levels) of statistical significance, all of them remained statistically significant at or above the traditional level of 95 percent confidence. In no sense does income inequality, as measured by the Gini Coefficient, explain the gap differences between progressive and conservative cities.
Quartile Comparisons
Next we replaced the Gini Coefficient with an income quartile comparison from Brookings Institution, and then we replaced the Gini Coefficient with an income quartile comparison from BLS.
Critics had suggested that while the Gini Index demonstrates overall inequality, it doesn’t account for the extremes. For example, you could have two cities with the same Gini Index, but one of those might have much wealthier higher-income households on one end and much poorer lower-income households on the other, with a large group in the middle having relatively little inequality while the other could have more variation in the middle and smaller extremes. While the Gini Index is widely used to talk about income inequality, some feel quartile comparisons are more descriptive and thus worth consideration.
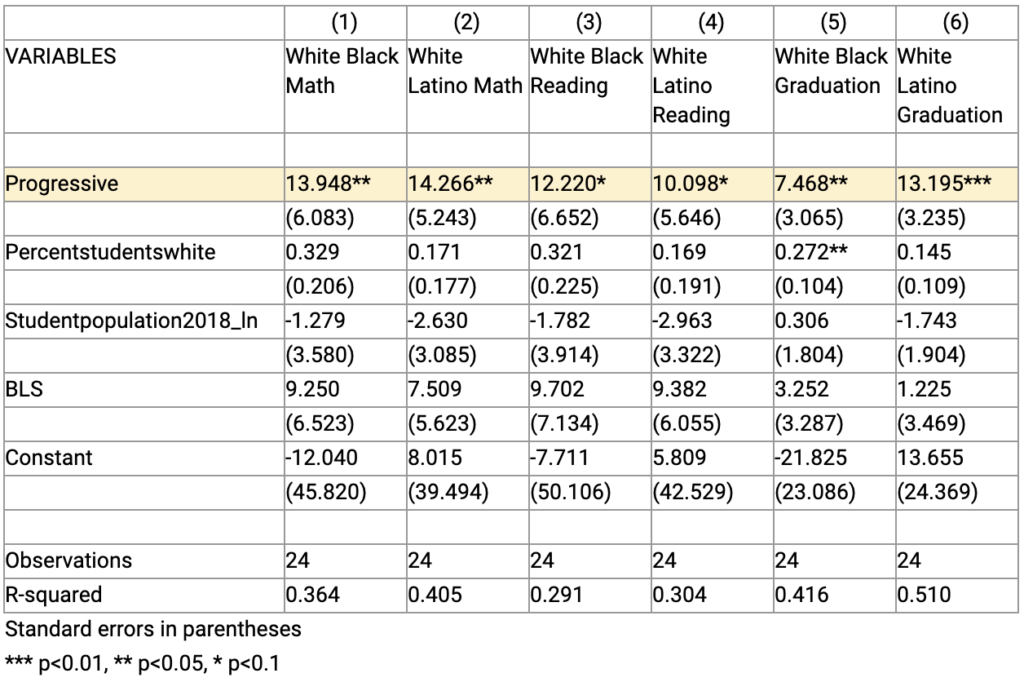
We pulled income inequality data from the BLS, which compares the 90th percentile income to the 10th percentile income in each city. Including this ratio produces results similar to what we published in “The Secret Shame” and to the regressions including Gini. Here, the gaps are still meaningful, although somewhat smaller. The reading gaps, compared to the original analysis, become marginally significant but still larger in progressive cities. The gaps in math and graduation rates get significantly larger in progressive cities.
Table 2S. Regression Test with BLS Data
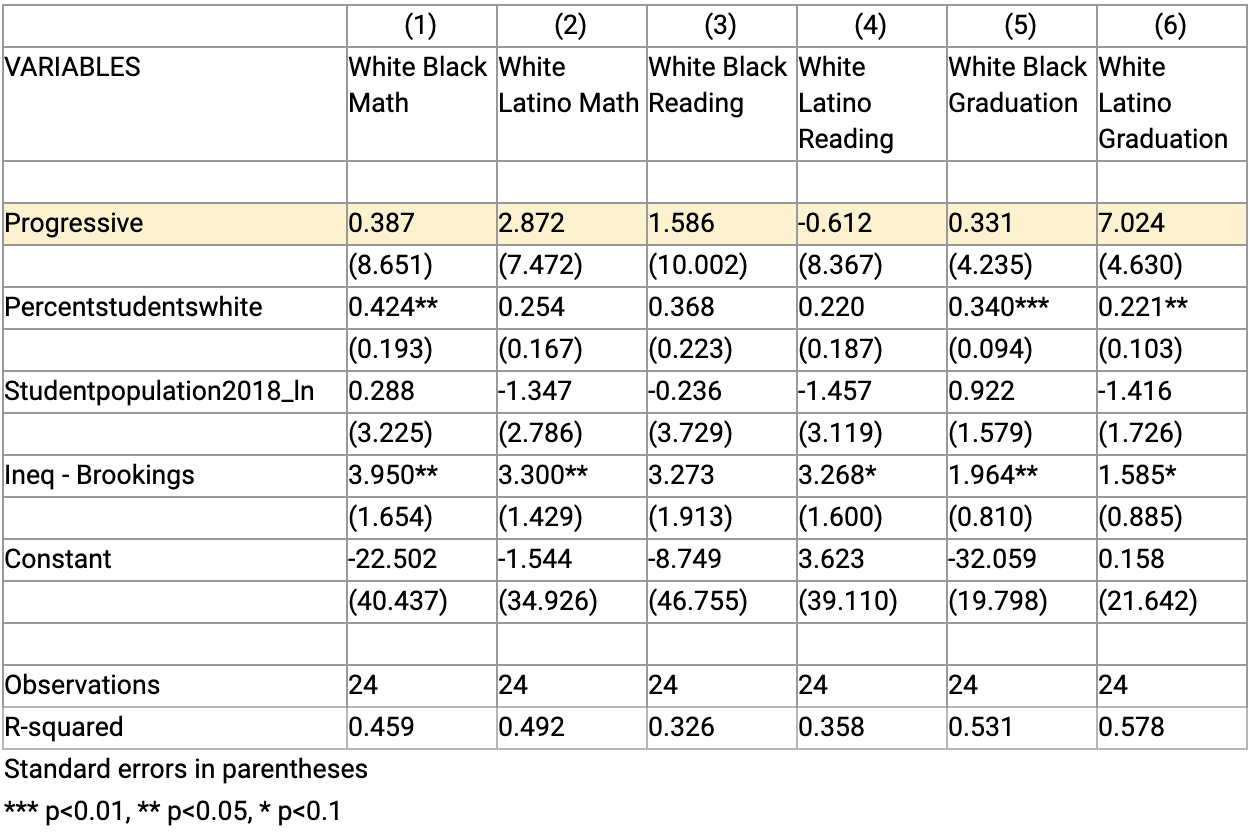
Including the household income inequality ratio from Brookings Institution (American Community Survey, 2016) as a variable produces no statistically significant gaps in any of the six regressions (black-white and Latino-white gaps in math, reading and graduation rates). In other words, using the Brookings method changes our original findings and erases the difference between progressive and conservative cities. Using that method, progressive and conservative cities are indistinguishable in terms of the size of their achievement gaps.
A reasonable interpretation of these regression results is that the higher racial achievement and attainment gaps in progressive cities compared to conservative cities are largely due to progressive cities having larger income gaps than conservative cities, at least using Brookings’ measure of income inequality. But it is unclear why critics prefer this variable. This ratio compares 95th percentile household income to 20th percentile household income in each city. Data used for the Brookings Institution approach is also older than the BLS data we used.
Table 3S. Regression Test with Brookings 95/20 Comparison
Finally, we tested the assumption that it’s not just income inequality, or income inequality at the extremes, but income inequality in the context of race that could produce different results.
The American Community Survey, an ongoing survey by the Census Bureau, publishes its Integrated Public Use Microdata Series (IPUMS) with information on race and income inequality.
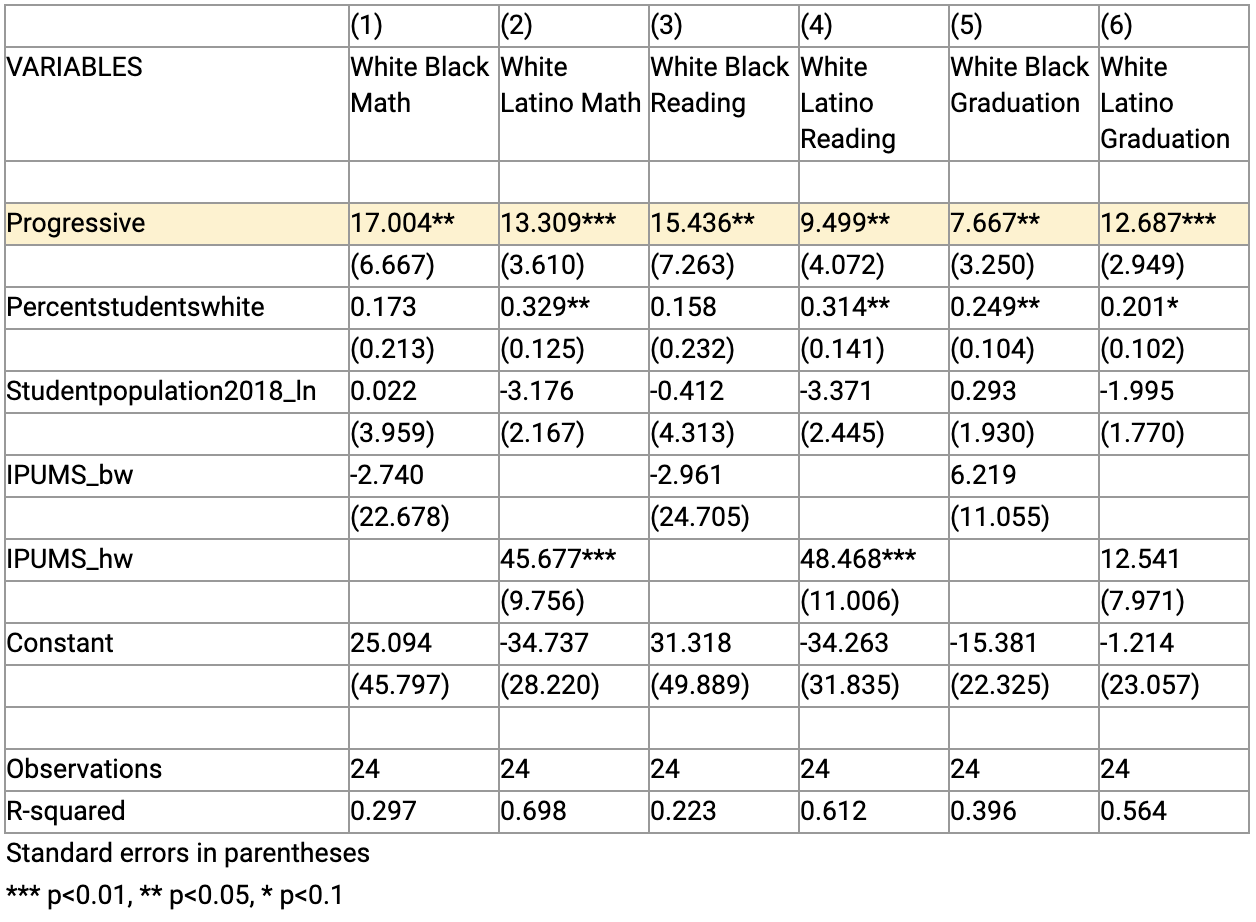
We retrieved average income by metropolitan area and race from IPUMS. Then we re-ran our regressions in two ways. The first was to create an IPUMS variable using the ratio of black-white and Latino-white average incomes. The results are essentially unchanged in all six outcomes of interest (See Table 4S. below). Large, statistically significant gaps remain for progressive cities compared to conservative cities.
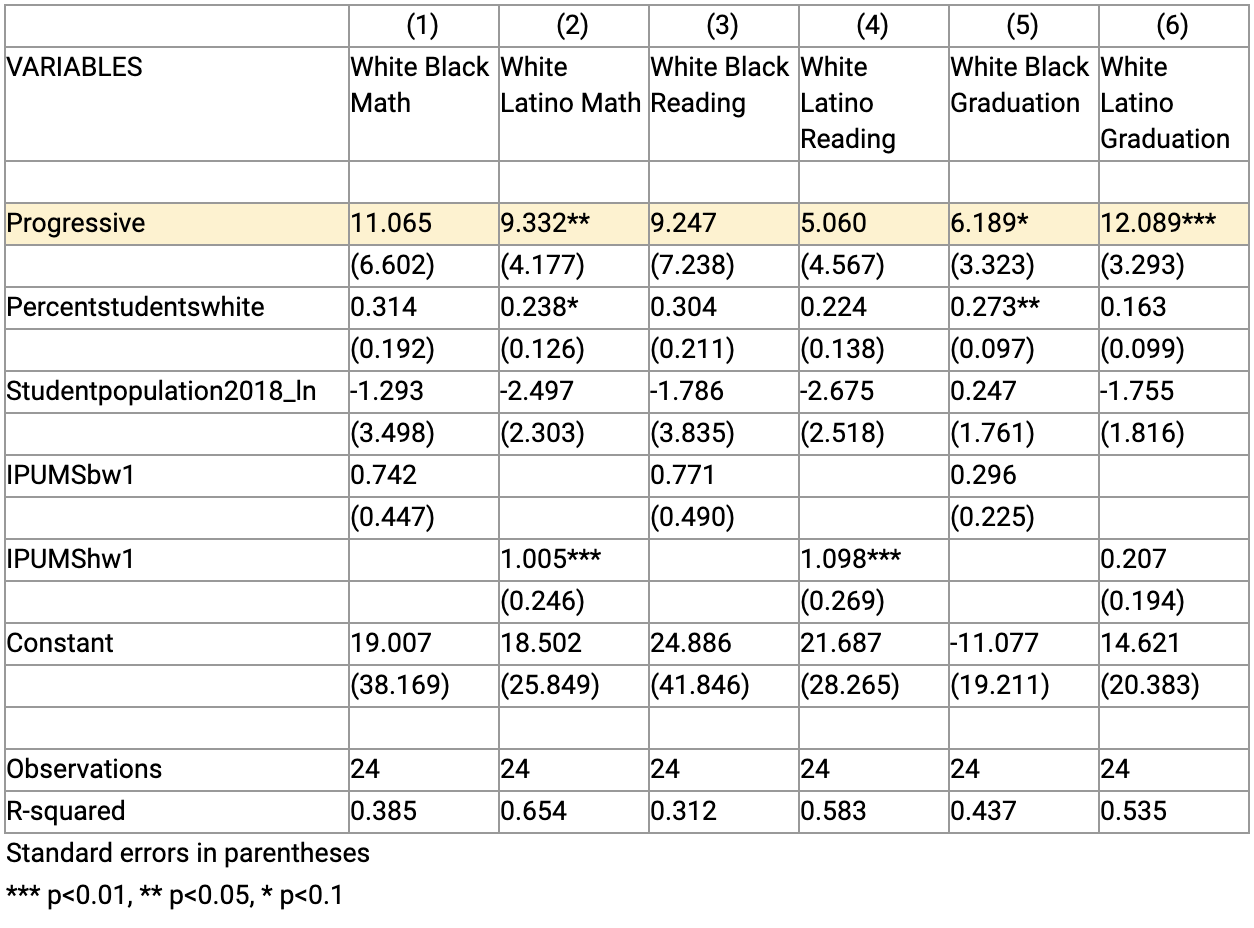
The second way uses the gross differences in average income between black and white students and Latino and white students. For example, if average white income is $60,000 and average black income is $30,000, then the gross difference is $30,000 (while the ratio, referenced above, is 2.0). Using gross differences makes the gaps practically smaller and eliminates statistical significance for 3 of the 6 outcomes (See Table 5S below). Latino-white Math proficiency gaps and both graduation gaps are statistically significant, but the differences in black-white math and reading scores and Latino-white reading scores are not distinguishable from 0.
Table 4S. Regression Test with IPUMS Racial Ratios
Table 5S. Regression Test with IPUMS Gross
Conclusion
To summarize, after running new regressions, our initial results are supported by adding Gini, BLS, and IPUMS ratio variables. The IPUMS gross variable weakens the size of the gaps, but some statistically significant gaps do remain. The Brookings Institution approach comparing the 95th percentile to the 20th percentile was the odd one out. It is older than the other inequality measures and rarely used, except by Brookings Institution. When a novel measure is the only thing that makes a relationship go away, we question the wisdom of using it.
While the Gini Index is the most widely used measure of income inequality, including the Gini Coefficient, the Bureau of Labor Statistics 90/10 comparison, or the IPUMS racial ratios, does not meaningfully change the results that the most progressive cities tend to have significantly larger achievement and attainment gaps than the most conservative cities.
While we consider this exercise important and worthwhile, it should not distract us from the important reality that black and Latino children, in almost every city we studied, are not getting the opportunities they need to close the gap with their white peers. That needs to change. We encourage you to review The Secret Shame: How America’s Most Progressive Cities Betray Their Commitment to Education Opportunity for All, and commit to taking action, as outlined in the recommendations section.

